Writing research papers is a part of university life. I have at least one paper due every semester. Typically, I would develop my thesis statement first, then search online at the university library or Google Scholar and finally develop support for my arguments. There will usually be various drafts and rewrites. However, this semester I was introduced to a technique of using diagrams as a methodology to prepare my research.
Back in the day, when I spent lots more time writing computer code, I recall experimenting with Mind Maps as a graphical way to express thoughts and a way of structuring those thoughts visually. I did a quick Google search and I see that the Mind Mapping community is alive and well. Author, Kristin Luker, in her book Salsa Dancing into the Social Sciences shares another method for structuring ideas and concepts visually. She refers to the process as the Bedraggled Daisy.
The technique was shared by a TA (Teachers Assistant) on one of my courses. He referred to the process as a Research Daisy. Another quick Google search revealed some images but I quickly found that the correct term is the Bedraggled Daisy.
Image courtesy Research Methods blog http://researchmethodsgroup2.blogspot.ca

For my purposes, the way I used the technique was to first start with a list of three high-level search terms that I would use if I were researching using my usual process. I would place those terms into a Venn diagram and the intersection of the circles should (I hope) represent the core of my research paper.
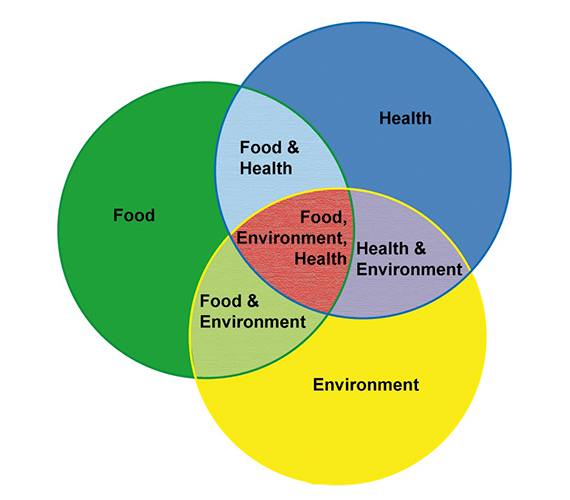
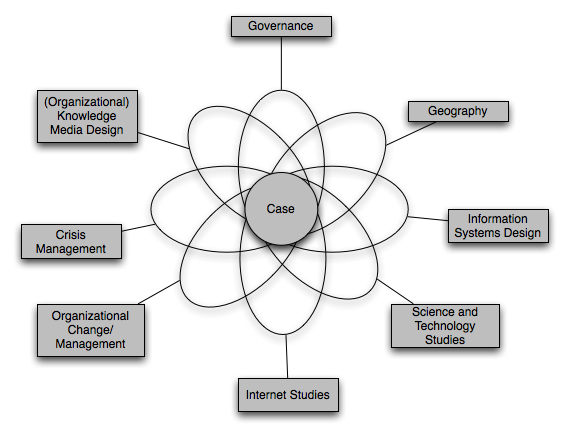
Once that was done then I would expand each of the three search terms until had eight or more potential search terms that touched on the various discussion points in my paper (see example above). I would research each of the search terms individually, but, this technique really shines when you start to build search strings based on the various intersections.
The concept of a Bedraggled Daisy is simple but I think it is effective because it allows you view the various aspects of your research diagrammatically and visually. The search strings that you build from looking at the intersections within the diagram are not logical. And, it is quite unlikely that you would come up with those searches on your own using traditional methods. However, the result, I hope, is the foundation for a thesis that addresses a real gap within your research topic.